
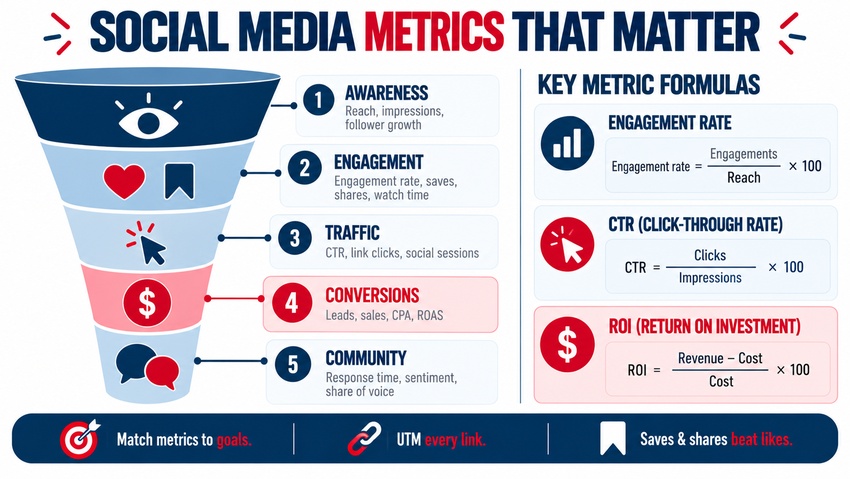
The key social media metrics every marketer should track fall into five groups: awareness (reach, impressions, follower growth), engagement (engagement rate, saves, shares, comments, video watch time), traffic (click-through rate, link clicks, sessions from social), conversions (leads, sales, conversion rate, cost per acquisition, ROI), and community and brand health (response time, sentiment, share of voice). Tracking the right metrics for each goal shows what content works, where to invest, and how social media contributes to revenue. Here's what each metric means, how to calculate it, and how to build a reporting system that leadership actually values.
Match Metrics to Goals
Not every metric matters for every campaign. Start with the goal:
| Goal | Primary Metrics | Supporting Metrics |
|---|---|---|
| Brand awareness | Reach, impressions, follower growth rate | Video views, share of voice |
| Engagement | Engagement rate, saves, shares, comments | Average watch time, story replies |
| Website traffic | Link clicks, CTR, sessions from social | Bounce rate, pages per session |
| Lead generation | Leads, conversion rate, cost per lead | Form completion rate |
| Sales | Revenue, ROAS, conversion rate, cost per acquisition | Average order value |
| Community and support | Response time, response rate, sentiment | Resolved issues, repeat engagement |
1. Awareness Metrics
Reach
The number of unique accounts that saw your content. Reach shows how far your message travels.
Impressions
The total number of times content was displayed, including repeat views by the same person.
Follower Growth Rate
Formula: (New followers in period ÷ followers at start of period) × 100
Growth rate is more meaningful than total follower count because it shows momentum.
Share of Voice
How often your brand is mentioned compared with competitors, measured with social listening tools.
2. Engagement Metrics
Engagement Rate
Common formula: (Total engagements ÷ reach) × 100
Engagements include likes, comments, shares, saves, and clicks depending on the platform. Some marketers divide by followers instead of reach; choose one method and use it consistently.
Saves and Shares
These are high-value signals: saves indicate content worth returning to, and shares spread content to new audiences. They often matter more than likes for reach and long-term impact.
Comments and Replies
Comments show conversation depth. Track not only volume but quality and sentiment. Reply strategy is covered in the art of responding to comments.
Video Metrics
- Average watch time and completion rate
- Hook rate (share of viewers who keep watching after the first few seconds)
- Replays on short-form platforms
Video-specific tactics are in the secrets to creating viral TikTok videos.
3. Traffic Metrics
Click-Through Rate (CTR)
Formula: (Link clicks ÷ impressions) × 100
CTR shows how effectively posts and ads drive action.
Sessions From Social
Use Google Analytics 4 with UTM parameters on every link to see how many visits come from each platform and campaign, and what those visitors do next. Analytics setup for social is covered in mastering Google Analytics to skyrocket your social media performance.
4. Conversion and Revenue Metrics
Conversions and Conversion Rate
Formula: (Conversions ÷ clicks or sessions) × 100
Conversions can be purchases, leads, sign-ups, bookings, or downloads, tracked through pixels, GA4 events, and CRM data.
Cost Per Lead and Cost Per Acquisition
Formula: Total spend ÷ number of leads (or customers)
Essential for paid social and for comparing platforms.
Return on Ad Spend (ROAS)
Formula: Revenue from ads ÷ ad spend
Social Media ROI
Formula: (Revenue attributed to social − total social costs) ÷ total social costs × 100
Include ad spend, tools, content production, and staff or agency time in costs for an honest view. ROI calculation methods are covered in how to calculate and maximize marketing ROI.
5. Community and Brand Health Metrics
- Average response time to comments and messages
- Response rate
- Sentiment (positive, neutral, negative mentions)
- Brand mentions and share of voice
- Customer satisfaction in social support interactions
Platform Analytics and Tools
| Tool Type | Examples | What It Covers |
|---|---|---|
| Native analytics | Meta Business Suite, TikTok Analytics, LinkedIn Analytics, YouTube Studio, Pinterest Analytics | Reach, engagement, audience data |
| Web analytics | Google Analytics 4 | Traffic and conversions from social |
| Social management platforms | Scheduling and reporting tools | Cross-platform dashboards, inbox metrics |
| Social listening | Listening and monitoring tools | Mentions, sentiment, share of voice |
| Ad managers | Meta Ads Manager, TikTok Ads Manager, LinkedIn Campaign Manager | Paid performance, CPA, ROAS |
Tool comparisons are in the best social media analytics tools for 2026.
Building a Social Media Report
- Start with business outcomes: leads, sales, revenue, and ROI
- Show supporting metrics: reach, engagement rate, CTR, and follower growth
- Highlight top-performing content and explain why it worked
- Compare periods month over month and year over year
- Include insights and next actions, not just numbers
Set targets with SMART goals for your social media campaigns, and measure engagement depth with how to measure engagement on social media.
Platform-Specific Metrics Worth Watching
Each platform emphasizes different signals:
- Instagram: reach from non-followers, saves, shares, Reels watch time, profile visits, and link taps in Stories
- TikTok: average watch time, completion rate, shares, and For You page traffic share
- LinkedIn: impressions, engagement rate, follower demographics by job function and industry, and lead form submissions
- YouTube: click-through rate on thumbnails, average view duration, returning viewers, and subscribers gained per video — see optimizing your YouTube channel for growth
- Facebook: reach, link clicks, group engagement, and event responses
- Pinterest: outbound clicks, saves, and impressions from search
- X: engagement rate, profile visits, and link clicks
Tracking a few platform-specific signals alongside your cross-platform metrics shows why content performs differently on each channel.
Vanity Metrics vs. Actionable Metrics
Follower counts and likes feel good but rarely prove business value alone. Actionable metrics — saves, shares, CTR, conversions, and cost per result — tell you what to change next. Use vanity metrics as context, not conclusions.
Key Takeaways
- Choose metrics based on goals: awareness, engagement, traffic, conversions, or community.
- Engagement rate, saves, shares, and watch time reveal content quality.
- UTM links and GA4 connect social activity to website behavior and conversions.
- Track cost per lead, ROAS, and ROI to prove business impact.
- Report outcomes first, then supporting metrics, insights, and next steps.
Frequently Asked Questions
What are the most important social media metrics?
The most important metrics depend on your goals, but commonly include reach, engagement rate, saves and shares, click-through rate, conversions, cost per acquisition, and ROI. For community-focused brands, response time and sentiment also matter.
How do you calculate social media engagement rate?
A common method is total engagements divided by reach, multiplied by 100. Engagements include likes, comments, shares, saves, and sometimes clicks. Some marketers divide by followers or impressions instead; the key is applying one method consistently over time.
What is a good engagement rate on social media?
Good engagement rates vary by platform, industry, content type, and audience size, and smaller accounts often achieve higher rates. Compare your results with your own historical performance and similar accounts in your niche rather than relying on one universal benchmark.
How do I track social media ROI?
Add UTM parameters to links, track conversions in Google Analytics 4 and your CRM, and use platform pixels for ad conversions. Calculate ROI by subtracting total social media costs from attributed revenue, then dividing by those costs and multiplying by 100.
Are follower counts important?
Follower counts provide context about potential reach, but they're less meaningful than engagement, traffic, and conversion metrics. A smaller, highly engaged audience that clicks and buys is usually more valuable than a large but inactive following.
Want social reporting that proves real business impact? AiScope Digital's social media management services and analytics and reporting services turn metrics into clear insights and growth plans — get a free consultation today.